Business Intelligence Solution
Collect your data from across the organization and display it in real-time on management dashboards. It’s as simple as that.

Why Is Using a Business Intelligence System Important?
Experience the Power of Data with Pegahe Aftab's Business Intelligence Services
Three decades of experience
Pegahe Aftab has three decades of experience in implementing business intelligence projects across various fields, including finance, administration, support, maintenance, and industrial automation.
Process-Oriented Approach
Pegahe Aftab's approach in all business intelligence projects is a process-oriented approach based on years of experience in developing process systems.
Variety of implementation tools
We are not limited to specific tools and will implement management dashboards based on your needs and preferences using Tableau, Qlik, Power BI, or other open-source tools.
Implementation of custom-specific needs
Relying on the expertise of Pegah Aftab's business intelligence team, we are ready to implement tailored solutions for various organizations and institutions.
Examples of Implemented Dashboards
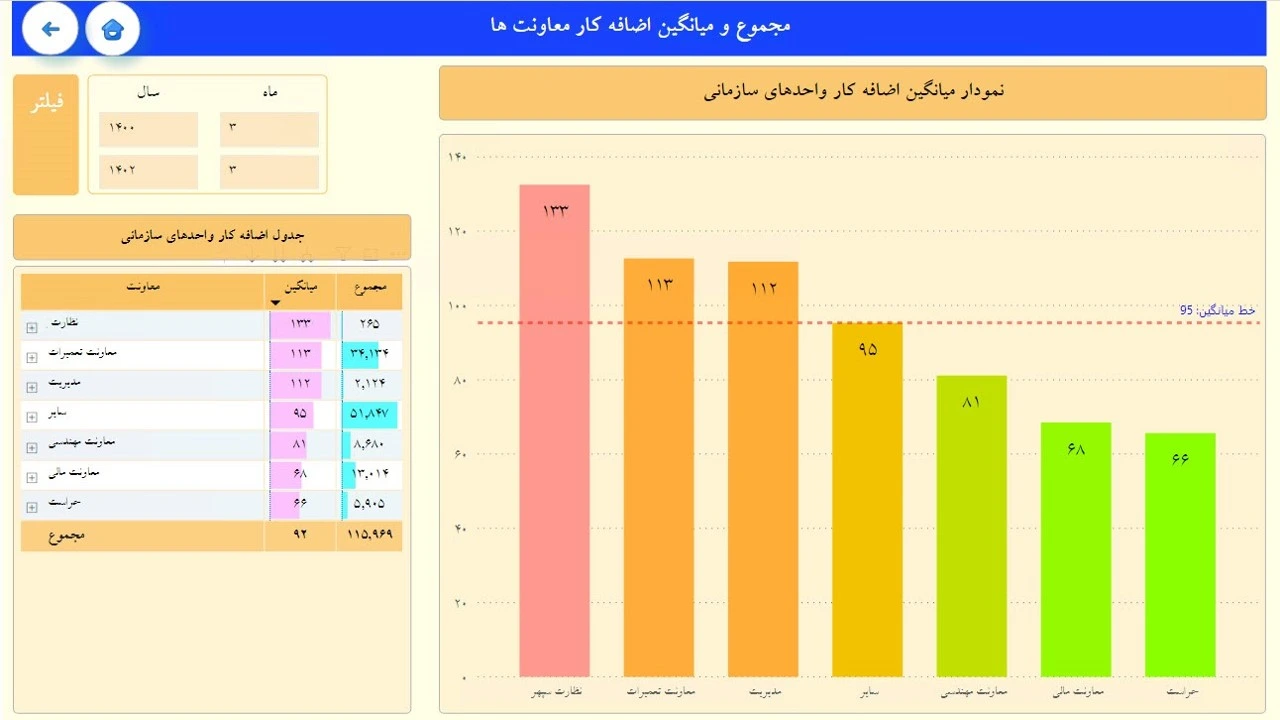
This dashboard, designed based on attendance data, displays the total and average overtime for each organizational unit according to different overtime categories (regular, substitution, night shifts, etc.) based on the organizational tree and hierarchical structure. It allows managers to align overtime status from the unit level down to individuals with priorities and guidelines, preventing deviations.
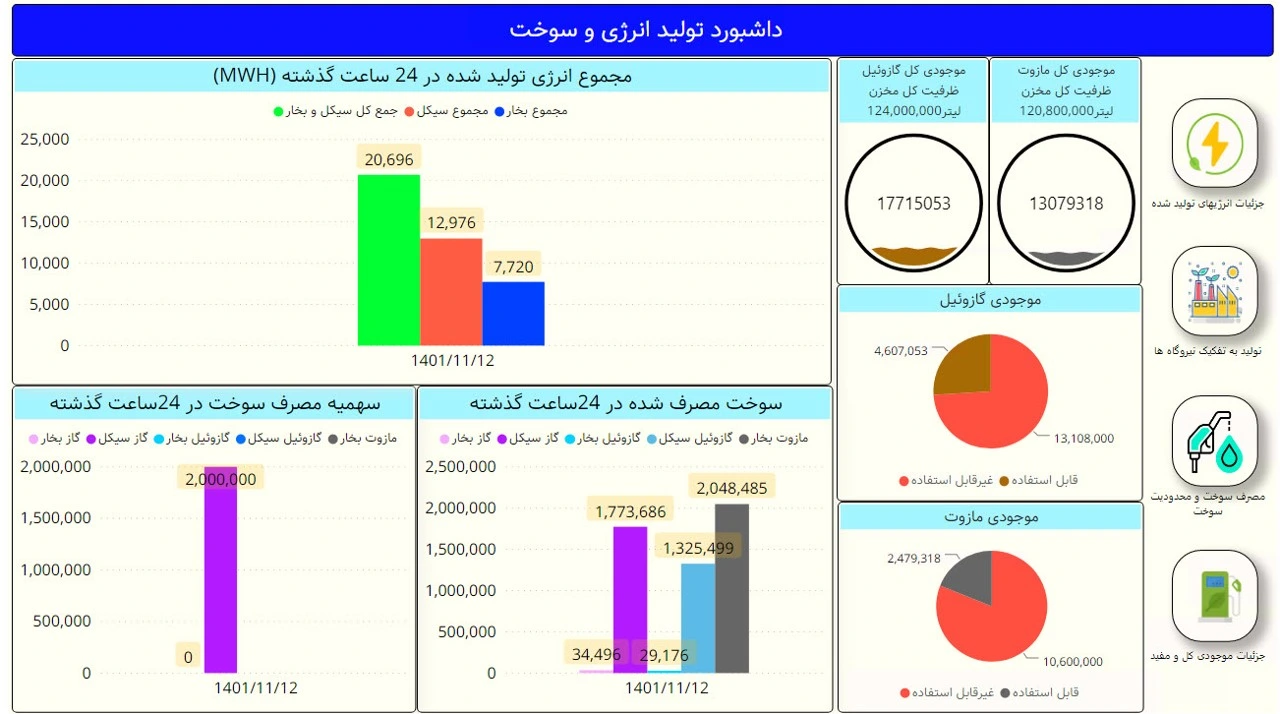
This dashboard is based on data extracted from processes implemented by the power plant organization using Pegahe Aftab’s process builder. It consolidates data related to daily fuel and energy consumption statistics and presents them across annual, monthly, weekly, and daily intervals. The primary function of this dashboard is to eliminate the need for repetitive data aggregation.
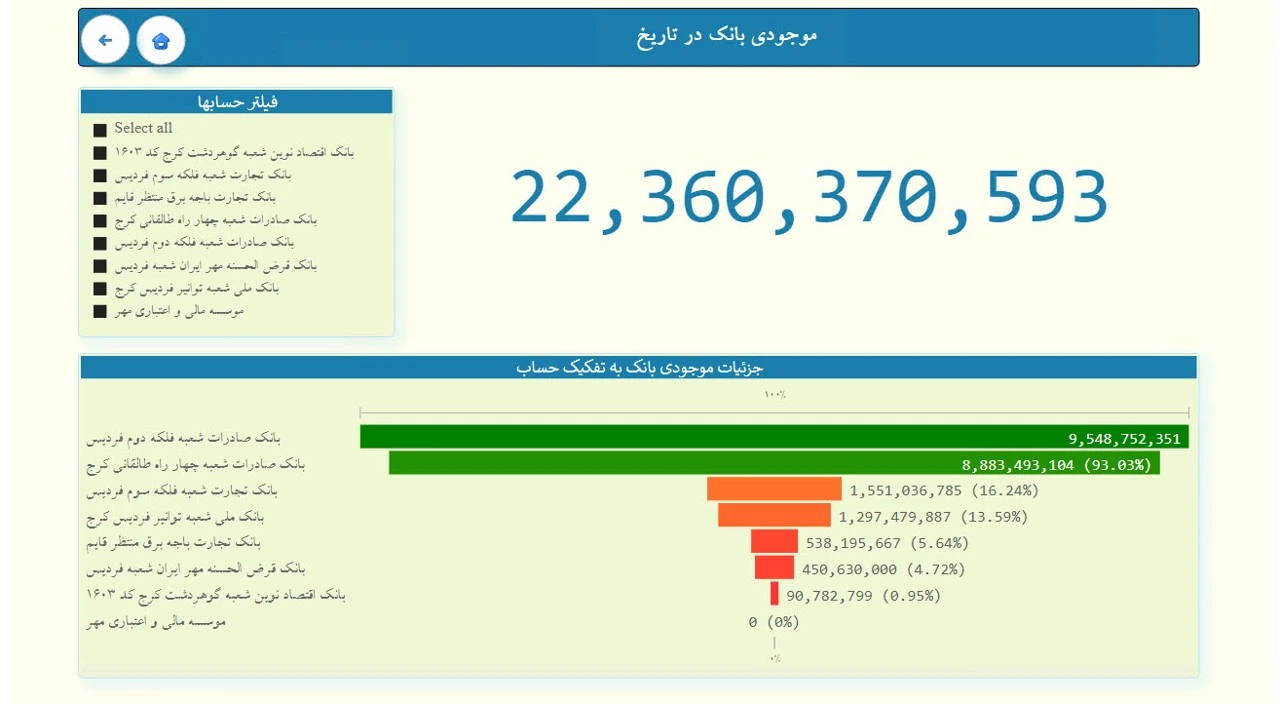
The purpose of this dashboard is to minimize the complexity of extracting bank account balance reports from bank records, enabling the relevant manager to instantly access the balances of various accounts across different banks without needing access to accounting systems or using standard accounting outputs. It also allows for easy definition of access levels to this information.
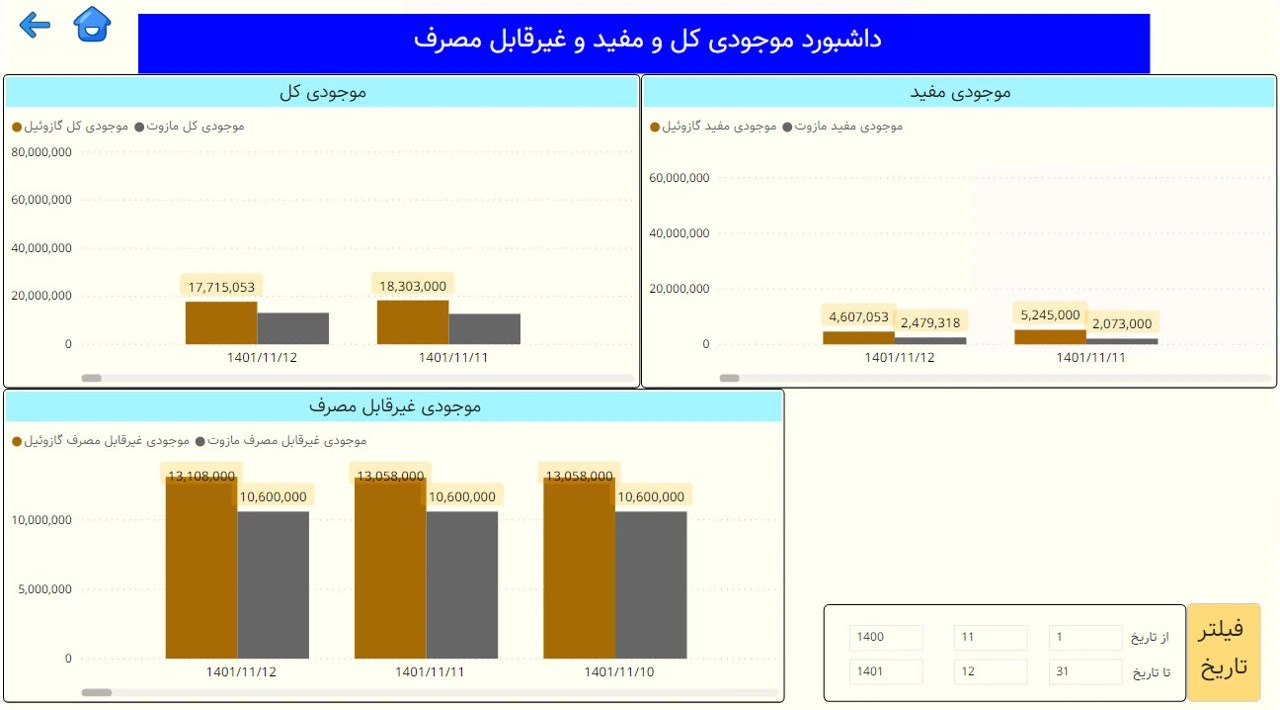
This dashboard combines the average consumption of goods over the past year with the current inventory levels of each item, displaying the monthly inventory status. It integrates this data with the inventory control system and the importance level of each item to generate an analytical and managerial report for decision-making regarding procurement or replenishment of critical and emergency items.
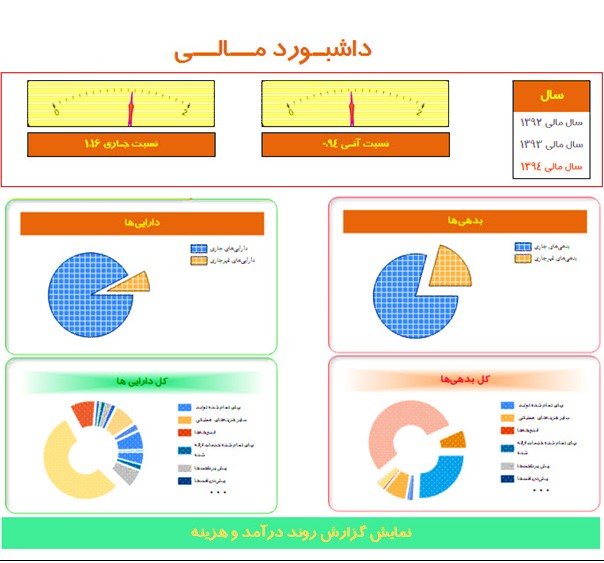
This dashboard displays the current ratio, quick ratio, the proportion of current to non-current liabilities, the proportion of current to non-current assets, and a breakdown of total assets and liabilities by their various types, with drill-down capabilities. Designed and implemented specifically for mid-level managers, the primary function of this dashboard and its reports is to provide insights into the organization’s revenues and expenses.
This dashboard displays well-known maintenance and repair metrics such as MTTR, MTBF, and Availability. Maintenance managers can use this dashboard to view these metrics based on maintenance activity components and, by comparing these metrics across different timeframes, monitor the performance of equipment classes, units, and maintenance activities in the shortest possible time.

The general steps for designing and implementing a system
No need to worry! Pegah Aftab will be with you every step of the way in designing, implementing, and supporting management dashboards.
We will begin by defining your needs, identifying, and redesigning your business processes. Then, by setting precise Key Performance Indicators (KPIs) and visualizing the data, customized dashboards for various business sections will be implemented and put into operation.
Once the deployment is complete, we won’t leave you alone. The Pegahe Aftab support team is ready to respond to any of your needs.
1. Identifying Resources
The first step in designing an effective management dashboard is identifying, clarifying, and optimizing processes. The Pegahe Aftab process team, with experience in implementing process management in dozens of organizations, will first focus on your processes to ensure that there are no obstacles in the way.
2. Define KPIs and KRIs
Key Performance Indicators (KPIs) are the heartbeat of a management dashboard system. With the help of business specialists, we extract the KPIs relevant to your industry and business, providing an integrated view of the data that reflects the overall status of the business and its various departments.
3. Data Visualization
Data visualization is the process of transforming data and KPIs into visual information. In this process, Pegahe Aftab prepares the data in various chart and graphic formats, allowing the end user to quickly and easily grasp the necessary information at a glance.
4. Dashboard Design and Implementation
Finally, dashboards emerge. Dashboards that empower managers to understand business intelligence and use it for more informed decision-making. In this step, you will be able to access the information you need in the shortest possible time.